The PTE Academic exam includes a task called Describe Image, which assesses your ability to describe visual content accurately and fluently in spoken English. You’ll be shown an image, and you are required to describe it in 40 seconds. This question type contributes only in the Speaking Module.
Understanding the Task
When you see an image on the screen during the exam, your goal is to give a clear, structured, and accurate description of what you see. It includes the following:
- You should describe the key elements in the image.
- You should explain the relationships between different parts of the image.
- You should conclude or make implications based on the image.
| Prompth length | Skill Assessed | Time To Answer |
| Not Applicable | Speaking | 40 seconds |
Scoring Criteria:
This question has 3 parameters for evaluation, which are content, fluency, and pronunciation. The response is also evaluated by a human expert for content before the final score is assigned.
Total Marks: 16
Content:
- 6 – The description is detailed and accurate, showing a deep understanding of the image. The response explains the connections between different parts of the image and offers a thoughtful interpretation.
- 5 – The main features of the image are described accurately, and some relationships between the features are mentioned, but not in much detail. The response is clear, and most details are correct.
- 4 – The description covers some of the key features, but some parts are not fully explained. The vocabulary used is simple, and there is some repetition.
- 3 – The description is basic and not very detailed. Some parts are inaccurate, and the vocabulary is simple and repeated. The listener can imagine parts of the image but not the whole picture.
- 2 – The description is minimal, with only a few details given, and there are some mistakes. The vocabulary is very limited. The listener can only visualize a few parts of the image, with effort.
- 1 – The response is just a list of points or disconnected ideas with no explanation. The vocabulary is very restricted, making it hard for the listener to picture the image.
0 – The description is too brief or unclear to give any real mental picture of the image.
Pronunciation:
- 5 –Native-like: The speaker pronounces all vowels and consonants clearly, so native speakers can easily understand them. They use natural speech patterns, and stress is placed correctly in words and sentences.
- 4 – Advanced: Most vowels and consonants are pronounced clearly. There might be a few small mistakes with sounds or stress, but it doesn’t affect understanding. The speaker is easy to understand, and stress is mostly correct.
- 3 – Good: Most vowels and consonants are correct, but there are some regular mistakes that may make a few words unclear. Some consonants might be mispronounced or left out. Stress on some words may not always be correct.
- 2 – Intermediate: Some vowels and consonants are pronounced incorrectly, making them harder to understand. About two-thirds of the speech is clear, but listeners might have to adjust to the accent. Some consonants might be missing or changed, and stress is sometimes wrong.
- 1 – Intrusive: Many vowels and consonants are mispronounced, making the accent forceful. About one-third of the words might be hard to understand. Some consonants are missing or changed, and stress is placed incorrectly in words or sentences.
- 0 – Non-English: The pronunciation sounds disparate from English. Many vowels and consonants are mispronounced, and more than half of the speech is hard to understand. The stress on words is also incorrect, and some words may have the wrong number of syllables.
Fluency:
- 5 – Native-like: The speech is smooth and flows well. There are no pauses, repeats, or mistakes that make it sound non-native.
- 4 – Advanced: The speech has a good rhythm with clear phrasing and word emphasis. There might be one pause, repeat, or mistake, but it’s still easy to understand.
- 3 – Good: The speech is at a good speed but may not always be even. There might be a few pauses or repeats, but most of the speech is clear and continuous. There are no long pauses.
- 2 – Intermediate: The speech might sound uneven or choppy. If the speaker says six or more words, there will be at least one smooth phrase. There might be a few pauses or repeats, but no more than two or three.
- 1 – Limited: The speech has irregular rhythm, with lots of pauses, repeats, or mistakes, making it hard to follow. Long sentences might have pauses, and the stress on words may be wrong.
Step 1: Study the Image Carefully
You are given 25 seconds to study the image before you speak. During this time, focus on:
- Identifying the main idea: What is the image showing as a whole? Is it a chart, graph, map, or photo?
- Examining key details: Pay attention to colors, people, objects, text, or any patterns that stand out. In graphs or tables, note specific data points or trends.
- Observing relationships: How do different elements in the image relate to each other? For instance, in a graph, you may notice a trend, peak, or comparison.
- Think about the implication: What does the image suggest, or what conclusion can be drawn from it?
Use your erasable notepad to jot down any key phrases or ideas. It will be helpful for response preparation.
Step 2: Organize Your Response
A structured and organized response will give you a much better chance at a higher score. Here’s how to structure your description:
- Introduction: Start by giving a general overview of the image. For example, “This is a bar chart comparing the annual sales of different products.”
- Details: Next, describe the key components of the image. If it’s a photograph, describe the main objects or people and their relationship to each other. If it’s a graph, mention the data points or trends.
- Example: “The chart shows that Product A has the highest sales, with over 500 units sold in the first quarter.”
- Example for a photo: “In the foreground, a man is sitting at a desk, working on a laptop, while in the background, there are bookshelves and a plant.”
- Conclusions/Implications: Give conclusion discuss possible implications of what is shown in the image.
- Example: “The data suggests that Product A is the most popular among customers, which could lead to an increase in demand.”
- Example for a photo: “The setting appears to be a modern office, suggesting a professional work environment.”
Let’s now practice with
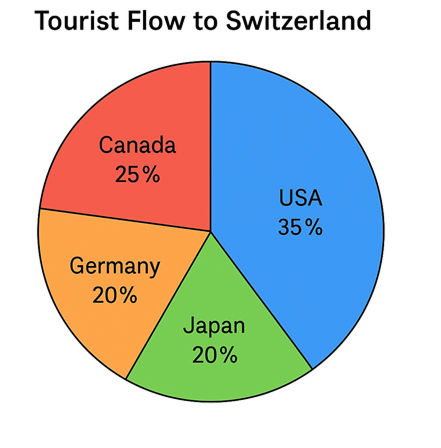
Sample Answer: This pie chart shows where tourists to Switzerland come from. Most tourists come from the USA, making up 35%. Canada is next with 25%. Germany and Japan each make up 20%. Together, the USA and Canada bring the most tourists, with a total of 60%. Germany and Japan have smaller but equal shares. Overall, the chart shows that most visitors to Switzerland come from North America.

Sample Answer: This line graph shows how coffee production changed over five years. In year 1, production was just above 1 million tons. It slowly increased each year. By year 3, it reached about 1.5 million tons. In year 5, it went up to more than 2 million tons. The graph shows a steady rise in coffee production over time. Overall, coffee production increased every year.
Step 3 : Speak Clearly and Fluently
When the recording starts, speak clearly and confidently. You have 40 seconds to complete your response, so pace yourself appropriately. Here are some tips to help you speak
fluently:
- Avoid rushing: There’s no need to speak too quickly. A steady, calm pace will make your response easier to understand.
- Use linking words: Linking words like “in addition,” “for example,” “therefore,” and “as a result” help you connect ideas and maintain a logical flow.
- Focus on pronunciation: Make sure your pronunciation is clear. Aim for natural stress on important words, and enunciate vowels and consonants properly.
- Use Variety in Vocabulary: To avoid repetition, mix up your vocabulary. For example, use “sitting” instead of always saying “seated,” or “behind” instead of repeating “at the back.
Step 4: Practice with Different Image Types
To be fully prepared for the Describe Image task, practice describing various types of images that you may encounter in the exam. These include:
- Photographs: These could feature people, places, or activities.
- Graphs/Charts: These include bar charts, line graphs, pie charts, and more.
- Maps: These may show different locations, routes, or geographical features.
- Tables: These could present data in rows and columns.
By practicing with different kinds of images, you’ll be able to present your response accurately in all types of images.
Step 5: Review Your Answer
In the PTE exam, you can only record your response once, so make sure you say everything accurately. For preparation, you can use Sumlingo practice software, and during preparation, you will get access to sample answers to get an idea about the presentation and check your response to make improvements.